Research Article 
![]() Creative Commons, CC-BY
Creative Commons, CC-BY
Biostatistical Models of Breaking the “Scream Effect” and “Echo Chamber Effect”
*Corresponding author:Bin Zhao, School of Science, Hubei University of Technology, Wuhan, Hubei, China
Received:December 09, 2022 Published:December 15, 2022
DOI: 10.34297/AJBSR.2022.17.002383
Abstract
This paper establishes a biostatistical model to describe the generation mechanism of neutral consensus and opinion polarization, explores the formation mechanism of the “screaming effect”, “echo chamber effect” and “information cocoon room”, and studies how to use reasonable strategies to avoid “Screaming effect” and “echo chamber effect” according to the biostatistical model built.
Keywords: Biostatistical model; Screaming effect; Echo chamber effect; Information cocoon
Introduction
Introduce the problem
The “screaming effect” is a well-known effect in psychology. For example, in a crowded public place, if someone suddenly screams hysterically, it can often quickly grab people’s attention. “Echo chamber effect”, or “stratosphere effect”, proposed by psychologist Cass R. Sunstein, refers to the fact that in a relatively closed media environment, some like-minded voices are repeated, even exaggerated and distorted, so that most people in the environment think that these voices are all the facts, unknowingly narrow their vision and understanding, and become self-sufficient and even paranoid [1].
Under the new information dissemination pattern, how to get rid of the “screaming effect” and “echo chamber effect” is an urgent practical problem that needs to be solved at present. That is, how to act from the top-level design of information transmission, the fairness of recommendation algorithms, and the responsibility of the majority of network users to help the public to have a relatively accurate and clear understanding and judgment of news events [2]. and even social reality and make a difference between mainstream awareness and personalized information. Find a balance between the Internet and make the network public opinion environment more rational and constructive.
Model Assumption
Basic model assumption
The model in this paper is based on the following reasonable
assumptions:
I. When an ignorant person touches the propagation
node, the probability of transforming into a propagation nodeis;
the unknown node transforms into a wait-and-see node is; when
the ignorant person encounters the information disseminator, it
indicates that he already knows the information, so he can learn
from the opposite The state of ignorance of the information turns
into the state of knowledge.
II. The probability that a wait-and-see state node will
transform into a propagation node when it encounters a propagation
node is, and the probability that a wait-and-see node will transform
into a propagation node due to its own reasons is.
III. The onlooker exits without forwarding the message and
becomes an immune person, with an exit probability of.
IV. The disseminator successfully forwards the message and
quits, becoming a quitter, with a quit probability of.
V. The data provided in this article are true and reliable,
and individual bad and missing data in this article have negligible
impact on the results;
VI. The people (nodes) in the information dissemination
model mentioned in this article are all individuals in line with
behavioral common sense, and there are no uncontrollable factors
(such as mental illness, etc.).
Data download
Reddits: Topics on the social networking site reddits contain content and comments on some topics(submissions) about abortion and gun control (Figure 1.1-Figure 1.2b).

Figure 1.1:Reddit topics about gun control.

Figure 1.2a: Comments about abortion, gun control in the topic section.
Quantitative description of information dissemination process
Classical SIR model: The SIR model describes some diseases can be cured and never be infected again. Individuals in the SIR model are divided into three stages: susceptible stage S, infected stage I and immune stage R. Among them, the infected individual will be cured, and after being cured, he can gain immunity and will no longer be infected, and will not spread the virus to other individuals, so he will no longer participate in the spread of the virus. The transmission mechanism of the SIR model is as follows: Individuals in the susceptible state S who come into contact with individuals in the infection state I might be infected into the I state, and individuals in the infection state I will infect other individuals, and at the same time might be cured and recovered and transform into an immune state R which will no longer be infected and spread the virus. As shown below.
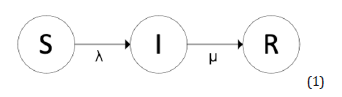
Differential Equation of the SIR Model:
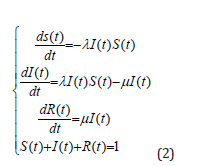
Where N is the total number of nodes in the network, t the number of nodes in the infected state in the time network is represented by S(t) , the number of infected state nodes in the time network is represented by I (t) . R(t) represents the number of R state nodes in the t time network, and λ is the infection rate, which represents the vulnerability of being infected when an infected S node touches an infected node I . μ is the cure rate, which indicates the probability that an infected node I is successfully cured.
The SIR model is more accurate than the SI and SIS models. Moreover, after a piece of information in social media is spread for a period of time, people will quit and stop spreading it, which is more in line with the characteristics of the SIR model. Therefore, it is relatively more appropriate to study information dissemination based on the SIR model.
Principle analysis of information dissemination model: The SIR model of infectious disease describes diseases for which one can never be infected if cured. Individuals in the SIR model are divided into three states: susceptible state S, infected state I and immune state R. The SIR model describes that the changes in the quantity of these three states are related to the infection rate λ , which represents the probability of being infected when the susceptible S node touches the infected state I node. μ is the cure rate, indicating the probausers will choose their attitude towards information independently according to their own wishes, ability that the infected state I node is successfully cured.
However, in information dissemination, d this will is not static. It will be affected by the surrounding environment and the people around them, so the information dissemination model of this paper is revised based on the SIR model. This paper adds an informed wait-and-see state on the basis of the SIR model. In the process of information dissemination, nodes in the unknown state have a certain probability of being infected by the propagation node to become a propagation node or a node in the wait-and-see state. Nodes in this state might be influenced by more people who spread this information and also spread this information, or just choose to quit directly to become immune. In the user’s social media, if the user sees a piece of information shared by a friend, it may not arouse his interest, but if several friends share it, the information will naturally be valued by the user, and it is more likely for the user to share this message. When a piece of current news information is ignored by the onlookers, but when encountering the disseminator of this information, the user also wants to know more about this information, so he also chooses to forward it, and then becomes a quitter, thereby generating the “scream effect” in network information dissemination.
If the nodes in the wait-and-see state in the model do not choose to propagate, they will probably choose to quit over time and become immune, and the propagating nodes will also become quitters after propagation. However, the circumstances of these two withdrawals are not the same. The former withdraws without dissemination, while the latter withdraws after dissemination. For the study of information dissemination, not only the scope of dissemination, but also the effect of dissemination are also very important. The number of dropouts does not give a clear indication of users’ attitudes towards information in the network. Compared with users who have not reposted, users who have reposted are more interested in this information. Therefore, in the model, we choose to separate the exit states of the two situations into those who have changed from the wait-and-see state and have not reposted immunity status, and the reposted exit status converted from the communication status. In this way, we can also intuitively see the user’s participation in the process of disseminating information.
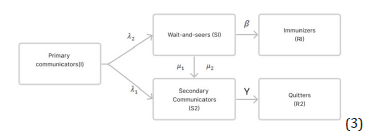
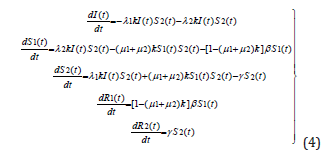
Construction of information dissemination model in this paper: N is the number of nodes in the entire network. I (t), S1(t), S 2(t), R1(t), R2(t) represents the number of primary communicators, onlookers, secondary communicators, immunizers, and quitters in the network nodes at time t , and the I (t) + S1(t) + S 2(t) + R1(t) + R2(t) = N holds . Set up the differential equations for the information propagation model, as shown below.
Build a model to describe the generation mechanism of neutral consensus and opinion polarization
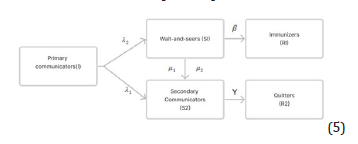
According to the principle analysis of the information dissemination model, we can know that: Neutral consensus: In the first round of communication by the unknown, λ 2 parameter increase and the number of onlookers increases. Since everyone does not spread, the number of immune people increases, which affects the scope and influence of information dissemination. (mostly on the sidelines➡immune)
Opinion polarization: Everyone only pays attention to what they want to pay attention to, which leads to an increase in parameter λ1 , an increase in the number of communicator. A decrease in parameter λ 2 and a decrease in the number of onlookers, which ultimately affects the results of information dissemination. Coupled with the influence of social platform recommendation algorithms, users The individual-centered moral judgment is dominant, and the degree of homogeneity and irrationality is relatively high. The comments were intense and the emotional catharsis was outstanding. (Most communicators ➡ quitters)
Symbiosis network analyses
Symbiosis network analysis is widely used to describe the
interaction mechanism between microbial communities, and it is
also applicable to the information dissemination mechanism in this
paper [2]. A co-occurrence network is an undirected graph where
nodes correspond to unique words in the vocabulary and edges
correspond to how often words co-occur in documents. Visualize
and extract information about relationships between words in a
corpus of documents using co-occurrence networks. Specific steps
are as follows:
a) Extract the text data in the file;
b) Tokenize the text, convert it to lowercase, and remove
stop words;
c) Create a word count matrix using the bag of words
model;
d) Multiply the word count matrix by its transpose to
calculate the total number of occurrences of words;
e) Use the graph function to convert the co-occurrence
matrix into a network;
f) Use the plot function to visualize the network (Figure
1.3a);
g) Use the neighbors function to find the neighbors of
the word “XXX”;
h) Visualize the co-occurrence of the word “XXX” by
extracting a subgraph of its neighbors (Figure 1.4a).
Figure 1.4(a) “police” neighbor visualization (gun control) Figure 1.4(b) “state” neighbor visualization (abortion).
Analysis of the results: Observing the symbiosis network Figure 1.4(a), we can see that the word “police” presents the characteristics of opinion polarization in the text of the gun control report. features of a neutral consensus.
Exploring the formation mechanism of the “screaming effect”, “echo chamber effect”
In the dissemination of information, users will independently choose their attitude towards information according to their own wishes, and this will is not static, it will be affected by the surrounding environment and the people around them [1]. It is precise because of the mechanism of neutral consensus and opinion polarization that people pay different attention to certain issues (such as different views on gun control and abortion).
The formation mechanism of “echo chamber effect”: In a relatively closed media environment, some voices with similar opinions are repeated, even exaggerated and distorted, so that most people in it think that these voices are all the facts, unknowingly narrow their vision and understanding, and become self-styled or even Paranoid polarization. Users will favor information that fits their worldview, ignore differing viewpoints, and form an “echo chamber” with other users who share the same viewpoint [3].

Figure 1.2b:Brain.

Figure 1.3a&1.3b:Visualized symbiotic network (gun control)
visualized symbiotic network (abortion).

Figure 1.4a&1.4b:“Police” neighbor visualization (gun control).
“state” neighbor visualization (abortion).
The formation mechanism of “screaming effect”: The media creates contradictions. With the polarization of opinions, social contradictions deepen, and more and more fuses that can detonate public emotions at any time are produced in the society. In addition, the media promotes and distorts the truth, and the public has long been in the “echo chamber effect” lost the ability to judge, and become perceptual, lack of analytical ability, often can be attracted by information, and lose independent judgment. The desire to forward information increases, and with the continuous growth of the number of forwarders, the number of forwarders shows an exponential growth, that is, the “screaming effect” in the dissemination of network information is produced.
Results
The influence of factors such as the attractiveness of discussion topics, user activity, user psychology, the interaction between different users, and platform recommendation algorithms on the formation of these phenomena

Figure 2.1:Trend diagram of the number of nodes in each state.
Simulation and analysis of information dissemination model: Use MATLAB software to solve the information dissemination model. Analyze the attractiveness of the topic to and number of primary communicators, wait-to-seers, secondary communicators, immunizers, and quitters. The change of activity of users, user psychology, interaction between different users, and platform recommendation algorithm over time is shown in Figure 2.1 below.
It can be seen from Figure 2.1 that the number of primary communicators decreases continuously in the process of information dissemination and decreases rapidly around the interval of t=2~5. In the steady state, only a small part of the number of primary communicators remains. The number of secondary communicators increases with the passage of time in the process of information dissemination, and the number reaches the maximum at t=2~3. The number of secondary communicators first increases and then decreases with the passage of time in the information dissemination process and reaches the maximum at t=4 and then decreases to 0. As the number of primary communicators in the network decreases, the number of secondary communicators increases, and they are inversely proportional to each other. The more secondary communicators, then primary communicators decline faster. Among the onlookers, due to contact with secondary communicators or their own reasons, some become secondary communicators, and some choose to quit transmission and become immune. However, as time goes by, the number of secondary communicators decreases, which can be seen as people’s curiosity and attention gradually decreases that after a period of time. No one among the user’s friends is still spreading this information, or the onlookers are not interested in this information, so the onlookers choose not to repost this message, and instead withdraw and become immune.
In addition, it can be seen that there are still a very small number of unknown nodes at the end, and the information is basically uploaded throughout the entire network. Since the information is forwarded, the communicators who have forwarded the information become quitters. The number of quitters who have forwarded the information is similar to the number of immunized people who have not forwarded it. The number of people participating in the spread accounts for about half. When the entire process of information dissemination is over, the numbers of the four types of people in the network, namely, waiters, sub-spreaders, quitters, and immunizers, all reach a stable value, and remain unchanged at about t=10.
Simulation and analysis of the transmission rate λ1 of primary communicators: The initial transmission rate λ1 can be understood as: the degree of attention people pay to the received information. The greater the degree of attention, the greater the probability of forwarding information, and vice versa. λ1 interpreted as the probability of an unknown state node being transformed into a propagation node when it touches a propagation node, expressed as the user’s activity; λ 2 interpreted as the probability of an unknown state node being transformed into a propagation node when it contacts a propagation node, expressed as the attractiveness of the topic, λ1 + λ 2 = 1 .)
In order to study the influence of the transmission rate λ1 of the primary communicator on the propagation process, keep other parameters unchanged, k = 0.01, λ 2 = 1 − λ1 = 0.8,μ1 = μ 2 = 0.175,β = 0.35 . Change the transmission probability of the primary communicator λ1 to 0.15 and 0.3 respectively and calculate the propagation process through MATLAB. Figure 2.2 shows the trend of the number of primary communicators, onlookers, secondary communicators, immunizers, and quitters over time under different transmission rates. The maximum value and time data of each state node are shown in Table 1.1 & Table 1.2.

Figure 2.2:Impact of the transmission rate of primary communicators λ1 on the five types of people.

Table 1.1:The maximum value reached by each state node under different λ1.
Result analysis: From the above comparison, it can be seen that changing the probability of forwarding λ1 (the probability of waiting and watching λ 2 ) when the initial communicator sees the information has a great impact on communication. This probability can also be seen as the activity of the user (the attraction of the topic). The larger the λ1 , the greater the intensity of information dissemination, and more people will receive the information, resulting in greater secondary dissemination.
Therefore, in order for a message to spread more widely, it is very important whether the message will make people want to forward it when it is seen. If it is news and entertainment news, whether the content is interesting is naturally the most important point related to whether people want to repost it. For merchants, many merchants adopt reposting lottery, which undoubtedly increases the probability of people reposting when they see the information. It is indeed a simple and effective way to promote their product information. As far as the media is concerned, digging out breaking news, deliberately inciting and exaggerating public sentiment, creates a wave of public opinion, that is, increases the exposure rate of information, increases the probability of people forwarding information, and thus causes the “screaming effect”.
Simulation and analysis of the propagation rate μ1 and μ2 of the observer: The transmission rate of the waiters can be defined as the probability that people forward information due to the influence of friends or their own reasons. The onlookers decide not to forward the information when they receive the information at the beginning, but they may forward it because they see the forwarding of their friends or because they slowly accept the information, and then change their minds and forward it.
μ1 : The probability that a wait-and-see state node will transform into a propagation node when it encounters a propagation node, that is, the mutual influence between different users: friend influence.
μ 2 : The probability that a wait-and-see state node is transformed into a propagation node due to its own reasons, that is, the mutual influence between different users: its own reasons.
Keeping other parameters unchanged, change the probability of the onlooker
μ1 = μ 2 = 0.175 to μ1 = μ 2 = 0.125, μ1 = μ 2 = 0.25 respectively. The propagation process is calculated by MATLAB. Figure 2.3 shows the trend of the number of primary communicators, onlookers, secondary communicators, immunizers, and quitters over time under different transmission rates. The maximum value and time data of each Figure 2. The influence of the transmission rate of the observers μ1 and μ 2 on the five types of people in the information network (Table 1.3 & Table 1.4).

Figure 2.3:The impact of the exit rate of the spectators on the five types of people.

Table 1.2:The time taken for each state node to reach the maximum value under different λ1 .

Table 1.3:The maximum value reached by each state node under different μ1 and μ 2 .

Table 1.4:The time taken for each state node to reach the maximum value under different μ1 and μ 2 .
Analysis of the results: It can be seen that the effect of changing the transmission rate of the onlookers is not as obvious as that of changing the transmission rate of the initial communicators. Although the number of retweeters varies greatly, it can be seen from the change curve of unknown nodes that changing the spread rate of wait-and-seers has significantly less impact on the spread speed and spread range. If you want to change the speed and scope of information dissemination, changing the transmission rate of the waiters is not as good as changing the transmission rate of the unknown, but its impact on the number of reposts cannot be ignored.
Simulation and analysis of the exit rate β of wait-and-seers: The exit rate β of the onlookers is the probability that users will completely lose interest in the information after receiving it, and the higher the value, the faster the onlookers will make the decision to quit the communication. β : the probability that a wait-and-see state node becomes an immune node without reposting, that is, the user’s psychology: the degree of disinterest in the topic.
In order to study the influence of the exit rate β of the onlooker on the propagation process, keep other parameters unchanged, k = 0.01, λ 2 = 1 − λ1 = 0.8,μ1 = μ 2 = 0.175 , change the exit rate β of the onlooker to 0.15 and 0.55 respectively, and calculate the propagation process through MATLAB, as shown in Figure 2.4. Table 1.5 & Table 1.6 show the trend of the number of primary communicators, onlookers, secondary communicators, immunizers, and quitters over time under different transmission rates, and the maximum value and time data of each status node.

Table 1.5:The maximum value reached by each state node under different β .

Table 1.6:The time taken for each state node to reach the maximum value under different β ..
Analysis of the results: With the increase of the withdrawal rate of wait-and-see, the number of immunized people who forwarded slightly increased, but the number of quitters after forwarding was slightly obvious. Due to the increase in the exit rate, the time for users to wait and see is shorter, and the number of users who lose patience and change their minds and choose to forward information is lower, resulting in a decrease in the forwarding rate of information and a worsening effect of information dissemination.
Simulation and analysis of network average degree k: The degree k of node i refers to the number of edges directly connected to node i, and the average degree refers to the average degree of all nodes in the network. k is the probability that a node touches a propagation node, which is used to represent the precise push of user information, that is, the platform recommendation algorithm.
In order to study the influence of network average degree k on the propagation process, keep other parameters unchanged, λ 2 = 1 − λ1 = 0.8,μ1 = μ 2 = 0.175 , change the network average degree k to 0.006 and 0.012 respectively, and calculate the propagation process through MATLAB. Figure 2.5 shows the primary communicators, Table 1.7 and Table 1.8 show the trend of the number of onlookers, secondary communicators, immunizers, and quitters over time, and the maximum value and time data of each status node.

Figure 2.4:The impact of network average degree on five types of people in the information network Table 1.7 The maximum value reached by each state node under different k.

Table 1.7:The maximum value reached by each state node under different k.

Table 1.8:The time taken for each state node to reach the maximum value under different k.
primary communicators, the increase in the number of secondary communicators, the increase in the number of quitters after information dissemination and forwarding, the greater the power and influence of information dissemination, and the number of untouched in the network The number of ignorants of the information becomes smaller and smaller until all users in the network are exposed to the information and the dissemination of information ceases.
Summary of the Experiment
From the perspective of comprehensively changing the influence of the three kinds of probabilities and the average degree of the network on the spread, changing the spread probability of the primary communicator and is the most obvious in terms of the speed and scope of the spread and the effect of the spread (that is, the impact of the number of reposts). Changing the propagation probability and of the waiter has little effect on the propagation speed, while changing the exit probability of the waiter has little effect on the propagation speed. Changing the average degree k of the network affects the speed and scope of the entire information dissemination. It can be seen that the most effective way to change the dissemination situation is to change the propagation probability and the network average degree k of the primary communicator, that is, when the user first sees the information. Possibility of forwarding and accurate push of users (platform recommendation algorithm).
For the improvement of network average degree k, further analysis, that is, the precise push of users, makes users in a relatively closed media environment, and some voices with similar opinions are repeated, even exaggerated and distorted, making most people think that these voices It is all the facts, unknowingly narrowing one’s vision and understanding, becoming complacent and even paranoid, resulting in the “echo chamber effect” in the dissemination of network information.
At 15:00 on April 19th, the owner of the Tesla climbed onto the roof and shouted that the brakes had failed. At this time, the public opinion reached its first peak, with more than 3,600 negative sentiments, and only 1,623 positive and 1,425 neutral sentiments. Public opinion is biased towards Tesla owners, accusing Tesla of disrespecting consumers for dumping the pot. From 5:00 pm on April 19th to the diffusion period on April 20th, both positive and negative emotions increase. On April 20th, car roof defenders were detained and notified. At this time, public opinion reached a new round of climax.
People’s Daily, CCTV News and other influential mainstream official media successively spoke out, digging into the cause of the situation, and multiple departments issued statements in response. At the same time, Sina Technology, Toutiao News and self-media accounts actively participated in the discussion of the situation. Driven by these media, netizens closely followed the situation and expressed their views, further promoting the fermentation of public opinion. At this time, there were more than 6,000 negative sentiments, and positive and neutral sentiments accounted for less than half of the negative sentiments. Tesla was criticized. By April 21, Tesla apologized, and at this time the mood of public opinion eased, and public opinion turned from condemnation of Tesla to discussions on the cause of the situation and how to solve it.
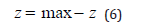
The attractiveness of the topic of the Tesla owner’s rights protection incident (which tends to a neutral consensus) the negative sentiment accounts for more than 3600, positive and neutral There are only 1623 and 1425 sentiments respectively. Experts are scored by Delphi method (the interval is 0-1, which is equivalent to normalization processing). In the processing of scoring, considering that positive emotions and neutral emotions are extremely large indicators, while negative emotions are extremely small indicators, so negative emotions need to be positively processed in the AHP. The formula for
positive processing used in this paper is (2) There are 6648 data in total.
From the figure, it can be seen that the public opinion transmission curve fluctuates according to time. By replacing the abnormal points of the curve, this article will get the average value of the curve is used as the source of data. As can be seen from the figure, the total number of user activity data is 1246. Since activity is a qualitative quantity, it is converted into quantitative data by means of expert scoring. Score the experts (the interval is 0-1, which is equivalent to normalization). For the interaction between users, it is mainly based on the main views of the main rights protection event.
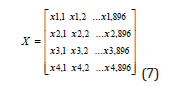
Through the standard normalization of the data of 12 views, 21,564 pieces of data are obtained. For the platform recommendation algorithm, it is mainly based on the key communicators of public opinion. It can be seen from the figure that public opinion is mainly spread through 10 aspects, and the key communicators can indirectly explain the platform recommendation. Algorithm, perform standard normalization processing on the above 10 data, and obtain 896 pieces of data.
Since it is necessary to evaluate the four indicators of topic attractiveness, user activity, user interaction and platform recommendation algorithm, a standardized matrix needs to be constructed, so that the minimum data volume of these four indicators is used as the evaluation indicator, which is 896 items, evenly shave the data exceeding the evaluation index. Therefore, there are a total of 4 evaluation objects and 896 evaluation indicators in this evaluation. Due to the forward processing of the above data, the forward matrix is:
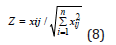
Due to the problem of dimensionality in the data, the data needs to be standardized. Then, the standardized matrix is recorded as Z, each element in Z:
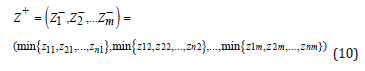
Define maximum:
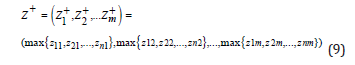
Define maximum:
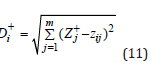
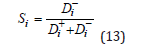
Define the distance between the i-th evaluation object and the maximum value:
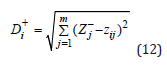
Define the distance between the i-th evaluation object and the minimum value:
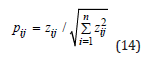
Calculate the unnormalized score of the i-th evaluation object:
Normalize the scores:
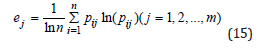
Calculate the information entropy of each indicator, and calculate the information utility value, and normalize to obtain the entropy weight of each indicator. For the jth indicator, the calculation
formula of its information entropy is
As shown in Table 1.9, the platform recommendation algorithm has the greatest impact on the “information cocoon room”, while the user’s activity has the least impact on the “information cocoon room”. Figure 2.6 shows the main idea of modeling.

Table 1.9:Relevant data obtained by entropy weight method.

Figure 2.5:The main idea of modeling.
results
Develop a reasonable strategy to break the “scream effect”
Brief introduction to the causes of the “screaming effect”:The media intentionally creates explosive news to attract the attention of customers, increase the attractiveness of the topic and the activity of users, as to achieve better information dissemination effect and produce a “screaming effect” in the dissemination of network information.
Develop a strategy: Start with information dissemination:The “scream effect” is mainly caused by increasing the propagation probability λ1 and λ2 of primary communicators, so appropriately reducing the propagation rate λ1 and λ2 in unknown nodes can effectively suppress the “scream effect”.
When users disseminate information, they often like to process the information according to their own likes and dislikes, or distort and split objective things according to their personal will. This kind of subjective and random evaluation can easily lead to information distortion. Therefore, users should improve their ability to identify information and judge objective facts. When using social networks to receive and disseminate information, they should maintain a clear understanding of the facts and objective and fair evaluation, and then make a correct decision to disseminate information.
Formulate reasonable strategies to break the “echo chamber effect”
Brief introduction to the causes of the “echo chamber effect”:Users are in a relatively closed media environment, and some voices with similar opinions are repeated, even exaggerated and distorted, making most of them think that these voices are all the facts, unknowingly narrowing their vision and understanding, and moving towards Complacent and even paranoid and polarized. Users will favor information that fits their worldview, ignore differing viewpoints, and form an “echo chamber” with other users who share the same viewpoint. Produce the “echo chamber effect” in the dissemination of network information.
Develop a strategy: Start with the platform
recommendation algorithm1) Use a plug-in to block all advertising spaces and
recommendation column information on the webpage;
2) Only look at the information of the users you follow,
not the information recommended by any algorithm;
3) Regularly clear, and re-focus on a new group of
people, and observe the opening of new modules;
4) Adhere to the orientation of terminal experience,
encourage relevant departments to conduct more investigations,
interviews, and accept evaluation feedback from netizens;
ensure that the recommendation algorithm realizes the dynamic
connection with mainstream values.
5) In terms of data collection, the “minimization
principle” must be well established to avoid vicious upgrades of
algorithm recommendations. By eliminating the bad experience
of algorithm recommendation service, we can provide a stronger
sense of comfort for the general public.
Reasonable Strategies to Avoid “Information Cocoons”
A brief introduction to the causes of “information cocoon room”:The so-called “information cocoon” refers to the fact that people’s own information needs are not comprehensive in information dissemination, and they only choose the information they want or makes them happy. Over time, the information they come into contact with becomes more and more limited. Shackle yourself in a “cocoon room” like a silkworm cocoon, lose the ability to understand and access other different information, and always only see what you think is the correct point of view.
Develop strategies
Start with the users themselves:
(1) Fine-tuning the cognitive schema
The so-called schema refers to the basic pattern of human cognitive behavior; when the characteristics of information match our cognitive schema, people are used to treating it with the original explanation and attitude; Only then will the old and new information be compared, and new information added to ensure new interpretations and attitudes. The result of new information processing will have two effects on the cognitive schema. One is the strengthening of old behavioral cognition. If there is a contradiction, it will be corrected to form a new schema. Second, the processing of new information will make its own analysis, reasoning and judgment.
From the perspective of development, only when we are constantly exposed to new information can the cognitive schema develop branches or make structural adjustments, and we can get out of the cage of the “information cocoon”.
(2) Improve partial eclipse
By labeling yourself or infiltrating into a certain field, you also need to have a comprehensive understanding of the knowledge in the field and don’t blindly follow other people’s opinions and suggestions. In this way, the probability of being affected by “group loneliness” under social media will continue to decrease. The acquisition of diversified information and the construction of a “diversified” circle is also necessary means to get rid of the “information cocoon”.
(3) Watch more, listen more, do more
Delete your historical browsing traces as much as possible, and immediately record or save it in your favorite content when you encounter something you like; this can ensure that the content you see is not recommended, but relatively random. More handson access to various platforms to obtain information is not “more hands-on likes”, so as to avoid misleading by a single platform. Be proactive and let go of old habits that may take you out of your comfort zone.
The ancients said: Listening together will bring clarity, and partial belief will bring darkness. When you acquire random information through multiple channels and in all directions, the information cocoon room will lose its foundation of existence, and it will naturally be self-defeating.
Discussion
Top-level design issues for government
Create a good social environment:The Internet department should actively create a good and sustainable social environment, adopt information filtering technology to eliminate false information, fraudulent information, and vicious dissemination of rumor information, and resolutely prevent such information from affecting users’ daily life and affecting users’ understanding of social networks with vastly different information judgment.
Strengthen the supervision of information:There are various forms of information dissemination in the network. Personalized pushes the news of its own platform to users, and users are more interested in these novel forms of information. However, some novel forms of information and content are not what users need, or even spam information, which has brought adverse effects on users’ life and work. Relevant government departments should stop and punish users who spread bad information and rumors in a timely manner, take effective measures, increase information supervision, actively curb the spread of bad information, and maintain a good information dissemination environment [4].
Leading issues for mainstream media
Improve media politics, authority, and credibility:The characteristics of mainstream media are political, authoritative, and influential, and they are high- end media and serious media. Its characteristics are first of all the media that can play a leading role, represent and influence public opinion, and have the function of the mouthpiece of the party, the government, and the people, such as various agencies, radio stations, and television stations. Secondly, the circulation and ratings of mainstream media are large, which affects the widespread attention of most people and takes them as the basis for thinking and action. Finally, it focuses on the mainstream issues of social development, reflecting the mainstream ideology and values of society. Therefore, it is a powerful media with wide coverage and great influence [5]. According to its own characteristics, in the general environment of this era, it is necessary to build up the credibility of the mainstream media in the hearts of the audience, grasp this principle unwaveringly for a long time, ensure that the credibility is properly displayed, safeguard the fundamental interests of the Chinese people, and show social the core values of communism will benefit our society.
New media has strong timeliness and interactivity, but the dissemination content lacks authority. We can learn from the advantages of traditional media and encourage traditional media reporters to give full play to their advantages [6,7]. Publish the most truthful and accurate information. Second, to curb the spread of online rumors and false news as quickly as possible, the media should increase supervision of information and quickly block and block false information. Finally, we should communicate with new media audiences in a timely manner, guide their doubts, and present persuasive facts before our eyes, so as to eliminate doubts and complete the work of guiding public opinion and establishing authority.
Improving the commercialization and entertainment environment of the media:Some highly entertaining and commercial information occupies a large proportion of new media information. In order to gain more attention, maximize drainage, and obtain better economic benefits, some sensational forms of entertainment have been derived. , Most of them are shallow and empty, and even try to relax people’s nervousness through dramatic and promiscuous performances in a vulgar, funny, and joking way. In the face of this cultural phenomenon, we need to be vigilant against this problem. On the one hand, relevant personnel in the media should use content selection and structure as the starting point to screen existing information to avoid readers being misled; On the one hand, it is necessary to guide the audience not to follow the trend blindly but to look at it from a rational perspective and improve their own quality [6].
Responsibility issues for the majority of internet users
Improve the ability of user information screening:When users use social networks to obtain information, they have to double-check the sources and distinguish the content of the information from different angles, especially those who are open to any bias. Pay attention to the platform for publishing information, the publisher of information, the objectivity of information, and the logic and factual basis of the information itself.
Help users forward information correctly:Users play the double role of receiver and forwarder in the network environment. When receiving information, users should properly screen health information, and when forwarding received information, they must actively consider the authority and authenticity of the information, and do not blindly forward false information. Fraudulent information should actively promote positive energy to the society.
Limit the amount of time users spend on social media:Take some time to unfollow accounts and people you’re no longer interested in. Turn off non-essential notifications and focus on what’s important. Limiting the time spent on social media to less than 30 minutes a day can greatly improve a person’s mental health. Reducing social media use time can significantly improve depressive symptoms and relieve loneliness.
Conflict of Interest
We have no conflict of interests to disclose and the manuscript has been read and approved by all named authors.
Acknowledgment
This work was supported by the Philosophical and Social Sciences Research Project of Hubei Education Department (19Y049), and the Staring Research Foundation for the Ph.D. of Hubei University of Technology (BSQD2019054), Hubei Province, China.
References
- Matteo C, Morales GDF, Galeazzi A, Quattrociocchi W, Starnini M (2021) The Echo Chamber Effect on Social Media. Proceedings of the National Academy of Sciences 118(9): e2023301118.
- Dandan W, Qian Y (2021) Echo Chamber Effect in Rumor Rebuttal Discussions About COVID-19 in China: Social Media Content and Network Analysis Journal of Medical Internet Research 23(3): e27009-e27009,
- Cota W, Ferreira SC, Pastor-Satorras R, Starnini M (2019) Quantifying Echo Chamber Effects in Information Spreading over Political Communication Networks. EPJ Data Science 8(1): 1-13.
- Wei L, Zhou W (2022) Research on Solving Path of Negative Effect of Information Cocoon Room‟ in Emergency.” Discrete Dynamics in Nature and Society p. 1-12.
- Cédric G (2014) Can digital technologies threaten democracy by creating information cocoons? Transforming politics and policy in the digital age. pp. 145-154.
- Hanqi P, Liu C (2021) Breaking the Information Cocoon: When Do People Actively Seek Conflicting Information? Proceedings of the Association for Information Science and Technology 58(1): 801-803.
- Andrew G (2018) Avoiding the echo chamber about echo chambers." Knight Foundation 2: 1-25.


 We use cookies to ensure you get the best experience on our website.